잘못된 내용은 언제든지 밑의 댓글로 알려주세요!
Multinomial Classification
1. Logistic Regression과의 차이점
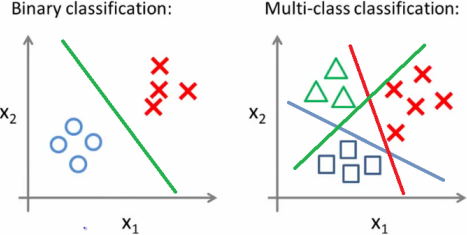
Multinomial Classification의 이름에서 알 수 있듯이, Multinomial Classification은 Logistic Regression과는 다르게 분류하고자 하는 Y가 binary형태가 아닌
세 가지 이상의 분류 값을 가진 Multinomial 형태 입니다.

그렇기에 이번 포스팅에서 sigmoid함수 이외에도 softmax함수를 추가로 설명하겠습니다. Sigmoid에 대한 설명은 이 링크를 통해 볼 수 있습니다. 그럼 시작하겠습니다.
2. Softmax 함수
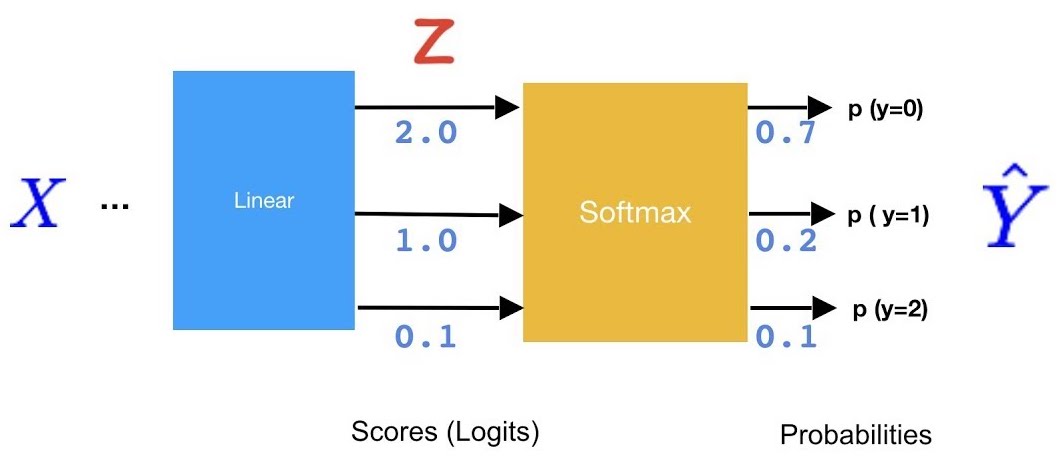
위 링크에서 Logistic Regression을 보셨다면, binary 분류를 위해서는 하나의 임계치값을 적용해서 크면 True, 작으면 False라고 출력하면 된다는 것을 아셨을 것입니다. 그런데 분류가 세 가지 이상이라면, 하나의 임계치값만으로 분류하는 것이 불가능합니다. 그래서 등장한게 최종 출력을 재조정해주는 Softmax 함수입니다. 우선 Softmax의 개념을 잘 설명해줄 수 있는 그림을 보겠습니다.

이 그림에서 softmax의 역할은 Z의 출력값을 각각의 확률값으로 변환해주어 확률값 arrary를 생성해주는 것입니다. 이 그림을 순서대로 설명하면 다음과 같습니다.
- X를 인풋으로 받아 Matrix 계산을 통해 Z 출력값을 구함
- Z 출력값을 Softmax의 인풋으로 받아
Hypothesis를 출력 Hypothesis의 가장 큰 값을 가진 Y를 최종 분류 값으로 설정.
3. softmax 공식과 적용
softmax 공식과 적용 방식을 살펴보겠습니다. 단순히 출력값을 다 더해 확률값으로 만들어준다라고 이해하고 넘어가셔도 무방합니다.
3-1. softmax 공식
softmax에 \(e\)를 취하는 것은 가중치를 준다고 생각하시면 됩니다. \(Z_j\) 커질 수록 그에 따라 확률이 일정하게 증가하는 것이 아닌, 기하급수적으로 증가하도록 하여 분류의 효율을 더 높여줍니다.
3-2. softmax 적용

최종적으로 출력된 \(Z_j\)를 전체 \(Z_j\)로 나누어 줌으로써 각각의 확률값을 구해줍니다. 이로써 softmax의 프로세스가 끝나게 됩니다.
3-3. One-hot Encoding
마지막으로 소프트맥스 함수의 최종 결과를 모델이 알아볼 수 있는 형태로 바꿔주어야 합니다. 이 과정에서 많이 쓰이는 알고리즘이 One-hot Encoding입니다.
위의 그림에서 나온 Softmax값에 One-hot Encoding을 적용하면 다음과 같이 표현됩니다.
- \[softmax(\bar{y}) = [0.7, 0.2, 0.1]\]
- \[one hot encoding(softmax(\bar{y})) = [1, 0, 0]\]
Multinomial Classification을 위한 기본 지식은 다 살펴 보았습니다. 이제 tensorflow로 코드를 구현해보겠습니다.
4. tensorflow 코드 구현
4-1. 데이터 불러오기 & 차원 정하기
먼저 데이터를 불러오고 차원을 정하는 방법은 회귀분석, 로지스틱 회귀분석과 거의 동일합니다.
1
2
3
4
5
6
7
8
9
10
11
12
import tensorflow.compat.v1 as tf
tf.disable_v2_behavior()
import matplotlib.pyplot as plt
import numpy as np
import pandas as pd

tf.set_random_seed(777)  # for reproducibility

# 데이터 로드
xy = np.loadtxt('/Users/minki/Downloads/data_zoo.csv', delimiter=',', dtype=np.float32)
x_data = xy[:, 0:-1]
y_data = xy[:, [-1]]
차원수를 정하기 위해 xy데이터를 일시적으로 데이터프레임으로 바꿔보겠습니다.
1
2
3
4
5
xy_data = pd.DataFrame(xy)
col_list = ['X1', 'X2', 'X3', 'X4', 'X5', 'X6', 'X7',
            'X8', 'X9', 'X10', 'X11', 'X12', 'X13', 'X14', 'X15', 'X16', 'Y']
xy_data.columns = col_list
xy_data.head()

위 데이터프레임을 보면 사용할 독립변수는 X1 ~ X16까지 총 16차원이며, 종속변수 Y는 1차원이지만 분류해야할 값들은 여러개가 있습니다. 따라서 이를 고려해서 차원과 분류 class 수를 정하면 다음과 같습니다.
1
2
3
4
5
6
7
8
# 분류하고자 하는 class 개수
# xy를 일시적으로 판다스로 만든 후 y열의 value값 종류를 카운트함.
nb_classes = len(xy_data['Y'].value_counts()) #7

# 독립변수인 X는 16차원
X = tf.placeholder(tf.float32, [None, 16])
# 종속변수인 Y는 1차원 => one_hot_encoding으로 표현됩니다.
Y = tf.placeholder(tf.int32, [None, 1])  # 0 ~ 6
여기서 다시한번 말씀드리지만, Y는 1차원 array인 [0, 0, 0, 0, 0, 1, 0, 0]의 One-hot-Encoding 형태로 표현됩니다!
4-2. One-hot Encoding
이제 y_data를 Y = tf.placeholder(tf.int32, [None, 1])인 tensor에 넣기 위해 One-hot Encoding 형태로 만들어야 합니다.
1
2
3
4
5
# one_hot_encoding으로 만드는 과정
Y_one_hot = tf.one_hot(Y, nb_classes)  # one hot
print("one_hot:", Y_one_hot) # shape=(?, 1, 7) => shape가 3차원으로 출력됨. 따라서 reshape를 통해 2차원으로 줄여야함.
Y_one_hot = tf.reshape(Y_one_hot, [-1, nb_classes]) # -1은 None이랑 같은 의미. [None, 7]과 같은 의미
print("reshape one_hot:", Y_one_hot) # shape = (?, 7)
이 부분에서도 주의해야할 점이 있는데, tf.one_hot을 적용하면 차원이 한차원 올라가니 꼭 tf.reshape를 사용하여 차원수를 다시 설정해 주어야 합니다.
4-3. W & b matrix 형성
이 부분도 전의 선형회귀분석, 로지스틱 회귀분석과 동일합니다.
1
2
3
# W 매트릭스와 bias value 형성
W = tf.Variable(tf.random_normal([16, nb_classes]), name='weight')
b = tf.Variable(tf.random_normal([nb_classes]), name='bias')
4-4. logits, Hypothesis, Cost, optimizer
이 코드부분에서 Multinomial classification을 위한 Softmax 함수가 등장합니다. 코드를 잘 봐주시길 바랍니다.
1
2
3
4
5
6
7
8
9
10
# tf.nn.softmax computes softmax activations
# softmax = exp(logits) / reduce_sum(exp(logits), dim)
# 단순 행렬곱인 matmul에 softmax를 취해 출력을 재조정함.
logits = tf.matmul(X, W) + b
hypothesis = tf.nn.softmax(logits)

# Cross entropy cost/loss
cost = tf.reduce_mean(tf.nn.softmax_cross_entropy_with_logits_v2(logits=logits,
                                                                 labels=tf.stop_gradient([Y_one_hot])))
optimizer = tf.train.GradientDescentOptimizer(learning_rate=0.1).minimize(cost)
cost 함수에 Hopothesis가 아닌 logits이 들어감을 주의해야 합니다.
4-5. Cost와 정확도 추출
이 부분에서는 tf.argmax, tf.cast, tf.equal과 같은 새로운 함수들이 많이 나옵니다. 주석을 달아놨으니 이 부분에 주의해서 보시면 금방 이해가 되실겁니다.
텐서플로우의 여러 함수에 대해서는 포스팅을 따로 하겠습니다.
1
2
3
4
5
6
7
8
9
10
11
12
13
14
# Cross entropy cost/loss
# cost 함수에 Hopothesis가 아닌 logits이 들어감을 주의해야 합니다.
cost = tf.reduce_mean(tf.nn.softmax_cross_entropy_with_logits_v2(logits=logits,
                                                                 labels=tf.stop_gradient([Y_one_hot])))
optimizer = tf.train.GradientDescentOptimizer(learning_rate=0.1).minimize(cost)

# argmax는 hypothesis로 나온 softmax array값 중에서 가장 큰 값을 뽑아줍니다.
# 예를 들어 [0.1, 0.1, 0.1, 0.2, 0.1, 0.1, 0.3] => 0.3이 가장 크므로 이에 해당되는 6이 출력됩니다.
prediction = tf.argmax(hypothesis, 1)

# tf.equal(x, y) : x, y를 비교하여 boolean 값을 반환해주는 함수입니다.
correct_prediction = tf.equal(prediction, tf.argmax(Y_one_hot, 1))
# tf.cast는 주어진 조건에 따라 나온 True or False값을 1 또는 0으로 변환해줍니다.
accuracy = tf.reduce_mean(tf.cast(correct_prediction, tf.float32))
4-6. 학습 및 결과
이제 tensorflow가 학습을 잘 진행하는지 살펴보겠습니다. 먼저 학습을 진행하기 위한 코드부터 보겠습니다.
1
2
3
4
5
6
7
8
9
10
11
12
13
14
15
cost_list = []
step_list = []
acc_list = []

# Launch graph
with tf.Session() as sess:
    sess.run(tf.global_variables_initializer())

    for step in range(2001):
        _, cost_val, acc_val = sess.run([optimizer, cost, accuracy], feed_dict={X: x_data, Y: y_data})

        if step % 10 == 0:
            cost_list.append(cost_val)
            step_list.append(step)
            acc_list.append(acc_val)
| Cost graph | Accuracy Graph |
|---|---|
 |
 |
위 그래프를 보면 학습이 진행될수록 Cost는 점점 줄어들고 Accuracy는 점점 커지고 있습니다. 따라서 텐서플로우 모델이 분류를 잘 수행하는 것을 알 수 있습니다. 마지막으로 전체 코드를 끝으로 포스팅을 마무리 하겠습니다.
5. 전체 코드
1
2
3
4
5
6
7
8
9
10
11
12
13
14
15
16
17
18
19
20
21
22
23
24
25
26
27
28
29
30
31
32
33
34
35
36
37
38
39
40
41
42
43
44
45
46
47
48
49
50
51
52
53
54
55
56
57
58
59
60
61
62
63
64
65
66
67
68
69
70
71
72
73
74
75
76
77
78
79
80
import tensorflow.compat.v1 as tf
tf.disable_v2_behavior()
import matplotlib.pyplot as plt
import numpy as np
import pandas as pd

tf.set_random_seed(777)  # for reproducibility

# 데이터 로드
xy = np.loadtxt('/Users/minki/Downloads/data_zoo.csv', delimiter=',', dtype=np.float32)
x_data = xy[:, 0:-1]
y_data = xy[:, [-1]]

xy_data = pd.DataFrame(xy)
col_list = ['X1', 'X2', 'X3', 'X4', 'X5', 'X6', 'X7',
            'X8', 'X9', 'X10', 'X11', 'X12', 'X13', 'X14', 'X15', 'X16', 'Y']
xy_data.columns = col_list

# 분류하고자 하는 class 개수
# xy를 일시적으로 판다스로 만든 후 y열의 value값 종류를 카운트함.
nb_classes = len(xy_data[16].value_counts()) #7

# 독립변수인 X는 16차원
X = tf.placeholder(tf.float32, [None, 16])
# 종속변수인 Y는 1차원 => one_hot_encoding으로 표현됩니다.
Y = tf.placeholder(tf.int32, [None, 1])  # 0 ~ 6

# one_hot_encoding으로 만드는 과정
Y_one_hot = tf.one_hot(Y, nb_classes)  # one hot
print("one_hot:", Y_one_hot) # shape=(?, 1, 7) => shape가 3차원으로 출력됨. 따라서 reshape를 통해 2차원으로 줄여야함.
Y_one_hot = tf.reshape(Y_one_hot, [-1, nb_classes]) # -1은 None이랑 같은 의미. [None, 7]과 같은 의미
print("reshape one_hot:", Y_one_hot) # shape = (?, 7)

# W 매트릭스와 bias value 형성

W = tf.Variable(tf.random_normal([16, nb_classes]), name='weight')
b = tf.Variable(tf.random_normal([nb_classes]), name='bias')

# tf.nn.softmax computes softmax activations
# softmax = exp(logits) / reduce_sum(exp(logits), dim)
# 단순 행렬곱인 matmul에 softmax를 취해 출력을 재조정함.
logits = tf.matmul(X, W) + b
hypothesis = tf.nn.softmax(logits)

# Cross entropy cost/loss
# cost 함수에 Hopothesis가 아닌 logits이 들어감을 주의해야 합니다.
cost = tf.reduce_mean(tf.nn.softmax_cross_entropy_with_logits_v2(logits=logits,
                                                                 labels=tf.stop_gradient([Y_one_hot])))
optimizer = tf.train.GradientDescentOptimizer(learning_rate=0.1).minimize(cost)

# argmax는 hypothesis로 나온 softmax array값 중에서 가장 큰 값을 뽑아줍니다.
# 예를 들어 [0.1, 0.1, 0.1, 0.2, 0.1, 0.1, 0.3] => 0.3이 가장 크므로 이에 해당되는 6이 출력됩니다.
prediction = tf.argmax(hypothesis, 1)

# tf.equal(x, y) : x, y를 비교하여 boolean 값을 반환해주는 함수입니다.
correct_prediction = tf.equal(prediction, tf.argmax(Y_one_hot, 1))
# tf.cast는 주어진 조건에 따라 나온 True or False값을 1 또는 0으로 변환해줍니다.
accuracy = tf.reduce_mean(tf.cast(correct_prediction, tf.float32))

cost_list = []
step_list = []
acc_list = []

# Launch graph
with tf.Session() as sess:
    sess.run(tf.global_variables_initializer())

    for step in range(2001):
        _, cost_val, acc_val = sess.run([optimizer, cost, accuracy], feed_dict={X: x_data, Y: y_data})

        if step % 10 == 0:
            cost_list.append(cost_val)
            step_list.append(step)
            acc_list.append(acc_val)

    # Let's see if we can predict
    pred = sess.run(prediction, feed_dict={X: x_data})
    # y_data: (N,1) = flatten => (N, ) matches pred.shape
    for p, y in zip(pred, y_data.flatten()):
        print("[{}] Prediction: {} True Y: {}".format(p == int(y), p, int(y)))