잘못된 내용은 언제든지 밑의 댓글로 알려주세요!
들어가기
Muliti-Variables Classification의 연장선으로 MNIST 데이터를 분류하기 위한 텐서플로우 코드를 짜보겠습니다. 텐서플로우 2.0 버전에서 코드를 짰기에 김성훈 교수님의 모두의 딥러닝에서 보신 코드와는 조금 다른 부분이 있습니다. 그럼 시작하겠습니다.
1. MNIST 데이터란?
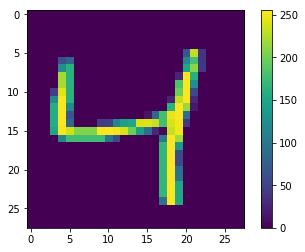
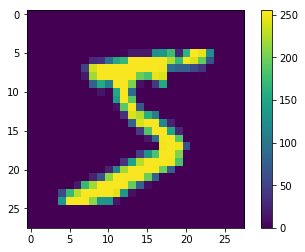
MNIST 데이터란 손글씨 이미지를 모아놓은 데이터로, 머신러닝에 있어서 매우 고전적으로 사용되는 데이터입니다. 데이터를 로드하고 손글씨 이미지가 어떻게 되어있는지 살펴보도록 하겠습니다.
1-1. 데이터 로드
우선 다음의 라이브러리를 Import 해야합니다. 이후 데이터는 Keras라이브러리에서 다운받았습니다.
1
2
3
4
5
6
7
8
9
10
11
12
13

# import tensorflow as tf
import tensorflow.compat.v1 as tf
tf.disable_v2_behavior()
import matplotlib.pyplot as plt
import random
import tensorflow_datasets as tfds
import numpy as np
import pandas as pd

tf.set_random_seed(777)  # for reproducibility

(train_images, train_labels), (test_images, test_labels) = tf.keras.datasets.mnist.load_data()
1-2. 차원 파악, 손글씨 그래프 출력
다음의 코드를 통해 차원과 손글씨 그래프를 출력해봅니다.
1
2
3
4
5
6
7
# 데이터 전처리

plt.figure()
plt.imshow(train_images[0]) #[0]은 첫번째 인덱스를 의미하므로 다른 숫자를 넣으셔도 됩니다.
plt.colorbar()
plt.grid(False)
plt.show()
| 숫자 4 MNIST 이미지 | 숫자 5 MNIST 이미지 |
|---|---|
 |
 |
위의 그림과 train_image.shape명령어를 통해 이미지의 차원을 출력해보면 이미지의 차원이 28*28로 구성되어 있음을 알 수 있고, 차원 안의 숫자들은
0~250의 범위에 분포해있음을 알 수 있습니다.
1-3. 데이터 전처리
이번 텐서플로우 코드에서는 인공신경망을 사용하지 않기때문에 전처리가 크게 유의미하지 않습니다. 그러나 일반적으로 신경망에 데이터를 넣을 때에는 데이터 값이 0~1사이에 있도록 하는게 이상적입니다. 그래서 다음의 코드를 통해 간단하게 전처리를 진행합니다. 250은 데이터 분포 중 가장 큰 값입니다.
1
2
train_images = train_images / 255.0
test_images = test_images / 255.0
그리고 또한 Weight과 Cost계산을 위해 데이터의 차원을 재조정해주어야 합니다.
1
2
3
4
5
6
7
# 독립변수 데이터
train_images = train_images.reshape(-1, 28*28)
test_images = test_images.reshape(-1, 28*28)

# 종속변수 데이터
train_labels = train_labels.reshape(-1, 1)
test_labels = test_labels.reshape(-1, 1)
2. Tensor 생성
이제 X, Y, Weight, bias 등 분석을 위한 다양한 텐서를 생성해야 합니다. 이 부분은 이미 한번 포스팅을 했으므로 잘 모르시겠다 하시는 분들은 이 글을 보시면 될 것 같습니다.
1
2
3
4
5
6
7
8
9
10
11
12
13
# array의 중복을 제거하고 라벨 수를 구하는 코드
nb_classes = len(set(train_labels))

# MNIST data image of shape 28 * 28 = 784
X = tf.placeholder(tf.float32, [None, 784])
# 0 - 9 digits recognition = 10 classes
# Y = tf.placeholder(tf.float32, [None, nb_classes])
Y = tf.placeholder(tf.int32, [None, 1])
Y_one_hot = tf.one_hot(Y, nb_classes, dtype=tf.float32)
Y_one_hot = tf.reshape(Y_one_hot, [-1, nb_classes])

W = tf.Variable(tf.random_normal([784, nb_classes]))
b = tf.Variable(tf.random_normal([nb_classes]))
여기서 tf.one_hot명령어를 사용할 때 주의해야할 점은 tf.one_hot의 대상이 되는 Y 변수가 꼭 tf.int32 or tf.int64형태로 선언되어야 한다는 것입니다. tf.float32로 설정할 경우 One-hot-Encoding을 수행할 수 없으니 주의해주세요.
3. Hypothesis와 Cost 및 Accuracy 계산
이제 가장 까다로운 부분입니다. 우선 코드를 보고 중요한 부분은 추가적으로 설명하겠습니다.
1
2
3
4
5
6
7
8
9
10
11
12
13
14
# Hypothesis (using softmax)
logits = tf.matmul(X, W) + b
hypothesis = tf.nn.softmax(tf.matmul(X, W) + b)

# Cost & Gradient Descent
cost = tf.reduce_mean(tf.nn.softmax_cross_entropy_with_logits_v2(logits=logits,
                                                                 labels=tf.stop_gradient([Y_one_hot])))
train = tf.train.GradientDescentOptimizer(learning_rate=0.1).minimize(cost)

# Test model
is_correct = tf.equal(tf.argmax(hypothesis, 1), tf.argmax(Y_one_hot, 1))

# Calculate accuracy
accuracy = tf.reduce_mean(tf.cast(is_correct, tf.float32))
여기서 Cost 함수 부분만 따로 보도록 하겠습니다. 여기 두개의 Cost함수 코드가 있습니다.
(tf.stop_gradient()함수는 이 부분에서 없어도 되므로 이해를 돕기 위해 제외했습니다.)
1
2
3
4
# Cost 1
cost = tf.reduce_mean(tf.nn.softmax_cross_entropy_with_logits_v2(logits=logits, labels=[Y_one_hot]))
# Cost 2
cost = tf.reduce_mean(-tf.reduce_sum(Y * tf.log(hypothesis), axis=1))
우선 위의 공식을 정확히 파악하기 위해, 위 공식에서 사용되는 함수를 하나하나 살펴보겠습니다.
3-1. tf.reduce_sum
tf.reduce_sum은 주어진 배열의 평균을 구하는 것입니다. 아래 코드와 결과값을 보시면 이해가 어렵지 않을 것입니다.
1
2
3
s = tf.Session()
e = tf.reduce_sum([.1, .3, .5, .9])
print(s.run(e))
3-2. tf.reduce_mean
tf.reduce_mean은 주어진 배열의 평균을 구하는 것입니다. 아래 코드와 결과값을 보시면 이해가 어렵지 않을 것입니다.
1
2
3
s = tf.Session()
d = tf.reduce_mean([.1, .3, .5, .9])
print(s.run(d)) #1.8/4 = 0.45
3-3. tf.nn.softmax
tf.nn.softmax는 주어진 배열을 확률로 변환해주는 것입니다. 아래 코드와 식을 번갈아 보시면 이해가 빠를 것입니다.
1
2
3
4
5
6
7
8
9
# 아래 코드와 밑의 코드가 같은 결과를 가짐을 알 수 있습니다.

s = tf.Session()
a = tf.constant(np.array([[.1, .3, .5, .9]]))
print(s.run(tf.nn.softmax(a))) # [0.16838508 0.205666   0.25120102 0.37474789]

b = tf.reduce_sum(tf.exp([.1, .3, .5, .9]))
c = tf.exp([.1, .3, .5, .9])
print(s.run(c)/s.run(b)) # [0.16838508 0.205666   0.25120102 0.37474789]
자 이제 본격적으로 Cost함수에 사용된 주된 함수를 보겠습니다.
3-4. tf.nn.softmax_cross_entropy_with_logits_v2(logit, label)
우선 텐서플로우 공식 홈페이지에서는 다음의 글로 위 함수를 설명하고 있습니다.
Computes softmax cross entropy between logits and labels.
위 설명을 읽어보면 대충 logits과 labels사이에 무슨 계산을 하는 것 같은데 위 말만 보고 이해가 쉽지 않으므로 자세히 설명해드리겠습니다.
함수가 길어서 겁먹기 쉽상이지만 이 코드에는 자신의 정체성을 뚜렷히 나타내는 두개의 명령어가 있습니다. 바로 softmax와 cross_entropy입니다.
softmax함수는 위에서 설명했으므로 cross_entropy함수를 추가적으로 더 보도록 하겠습니다.
3-4-1. cross_entropy 함수
우선 위 함수에서 쓰인 cross_entropy함수는 다음과 같습니다. 여기서 q는 실제 함수 분포이고, p는 예측 함수 분포입니다.
자 그리고 이해를 쉽게 하기 위해 a, b, c를 예측하는 문제가 있다고 가정합시다. 그리고 이것의 one-hot-encoding과 softmax 값은 다음과 같습니다.
- softmax 배열 = [0.5, 0.3, 0.2]
- one-hot-encoding = [1, 0, 0]
그럼 위 공식에 따른 \(H_p(q)\) 즉 Cost값은 다음과 같습니다. 그리고 위 공식에서 softmax는 one-hot-encoding의 예측결과에 맞는 값을 도출했습니다.
여기서 0인 부분은 사라지니 남는 것은 \(H_p(q) = {-[1*log(0.5)}\)입니다. 그리고 이를 통해 우리는 한 가지 사실을 알 수 있습니다.
- 예측이 정답일경우 -> 1과 곱해지는 \(log(softmax)\)값은 작아진다.(로그에 음수가 씌어져 있기 때문)
- 그러므로 예측이 정답일 경우 Cost 값은 작아진다.
그리고 제가 말한 이 과정을 softmax와 cross_entropy로 나누는 것이 아니라 한번에 처리해주는 함수가 바로 tf.nn.softmax_cross_entropy_with_logits_v2(logit, label)함수 입니다.
설명이 길었으나 이것만 기억하시면 됩니다. 예측이 정답일 경우 Cost값은 작아진다. 그럼 이제 다음 함수 보겠습니다.
3-5. -tf.reduce_sum(Y * tf.log(hypothesis))
위에서 중요한 함수는 이미 다 말씀드린것 같으므로 바로 Cost함수를 보도록 하겠습니다. 우선 이 함수의 식을 살펴보겠습니다.
전 식과 비슷하게 위의 식에서 \(L_i\)는 실제 값을, \(\bar{y}\)는 예측값을 의미합니다. 이제 위의 식처럼 예를 들어 보겠습니다.
- 실제값 \(L_i\) = [1, 0, 0]
- 정답인 예측값 \(\bar{y}\) = [1, 0, 0]
- 오답인 예측값 \(\bar{y}\) = [0, 1, 0]
우선 하나는 맞췄고, 하나는 틀렸다고 가정합니다. 그럼 이제 Cost계산을 살펴보겠습니다. 여기서 주의해야할 것은 예측값과 실제값을 곱할 때 행렬곱이 아니라 일반적인 곱셈입니다.
- 정답일 경우 \(Cost = -[1*log(1) + 0*log(0) + 0*log(0)] = 0\) => 매우 작다
- 오답일 경우 \(Cost = -[1*log(0) + 0*log(1) + 0*log(0)] = \infty\) => 매우 크다
이처럼 이 함수도 전의 함수와 같이 예측이 정답일 경우 Cost값은 작아집니다. 따라서 다음 두 Cost함수는 결과값은 다를지라도 실제로 같은 의미를 지닌 함수 입니다.
4. 학습 결과
학습 과정은 로지스틱 Regression, Multi-Variables Classification과 비슷합니다. 다만 차이점은 Mini-batch를 사용하여 데이터를 작게 쪼개어 모델에 넣어 학습했다는 것입니다.
1
2
3
4
5
6
7
8
9
10
11
12
13
14
15
16
17
18
19
20
21
22
23
24
25
26
27
28
29
30
31
32
33
34
35
36
37
38
39
40
41
42
# parameters
num_epochs = 15
batch_size = 100
num_iterations = int(int(train_labels.shape[0]) / batch_size)

epoch_list = []
batch_list = []
cost_list_batch = []
cost_list_epoch = []

with tf.Session() as sess:
    # Initialize TensorFlow variables
    sess.run(tf.global_variables_initializer())
    # Training cycle
    for epoch in range(num_epochs):
        avg_cost = 0

        for i in range(num_iterations):
            index = i*batch_size
            batch_xs = train_images[index:index+batch_size,:]
            batch_ys = train_labels[index:index+batch_size,:]
            _, cost_val = sess.run([train, cost], feed_dict={X: batch_xs, Y: batch_ys})
            avg_cost += cost_val / num_iterations

            batch_list.append(i+1)
            cost_list_batch.append(cost_val)


        epoch_list.append(epoch)
        cost_list_epoch.append(avg_cost)

        print("Epoch: {:04d}, Cost: {:.9f}".format(epoch + 1, avg_cost))

    print("Learning finished")

    # Test the model using test sets
    print(
        "Accuracy: ",
        accuracy.eval(
            session=sess, feed_dict={X: test_images, Y: test_labels}
        ),
    )
학습 과정은 어렵지 않게 산출할 수 있었습니다. 여기서 주의해야할 점은 batch_size가 추가되었단 것입니다. 만약 텐서플로우에서 데이터 타입이 DataSet이라면
다음과 같은 명령어로 쉽게 batch_size를 부여할 수 있습니다.
1
batch_xs, batch_ys = mnist.train.next_batch(batch_size)
그리고 또한 제가 위의 두 함수가 의미적으로 같은 함수라고 말했는데, 실제로 두 함수를 비교해서 Cost값을 산출한 결과도 다음과 같습니다.
| tf.nn.softmax_cross_entropy_with_logits_v2 | -tf.reduce_sum(Y * tf.log(hypothesis)) |
|---|---|
| 0.8911 | 0.888 |
5. 그래프
마지막으로 batch와 epoch를 기준으로 학습이 어떻게 되는지 그래프를 보도록 하겠습니다.

- epoch : 전체 데이터를 학습한 횟수 (ex. epoch = 15, 전체데이터를 15번 학습)
- batch : 전체데이터를 나누는 개수 (ex. batch = 100, 전체데이터를 100개씩 쪼개서 학습)
위의 그래프를 보시면 학습이 증가할수록 Cost값이 감소함을 볼 수 있습니다. 이로써 성공적으로 MNIST 데이터를 분류했다고 볼 수 있습니다.
6. 전체 코드
1
2
3
4
5
6
7
8
9
10
11
12
13
14
15
16
17
18
19
20
21
22
23
24
25
26
27
28
29
30
31
32
33
34
35
36
37
38
39
40
41
42
43
44
45
46
47
48
49
50
51
52
53
54
55
56
57
58
59
60
61
62
63
64
65
66
67
68
69
70
71
72
73
74
75
76
77
78
79
80
81
82
83
84
85
86
87
88
89
90
91
92
93
94
95
96
97
98
99
100
101
102
103
104
105
106
107
108
109
110
111
112
113
114
115
116
117
118
119
120
121
122
123
124
125
126
127
128
# import tensorflow as tf
import tensorflow.compat.v1 as tf
tf.disable_v2_behavior()
import matplotlib.pyplot as plt
import random
import tensorflow_datasets as tfds
import numpy as np
import pandas as pd

tf.set_random_seed(777)  # for reproducibility

# 데이터 불러오기
(train_images, train_labels), (test_images, test_labels) = tf.keras.datasets.mnist.load_data()

# 이미지 출력
plt.figure()
plt.imshow(train_images[0])
plt.colorbar()
plt.grid(False)
plt.show()

# 데이터 전처리
train_images = train_images / 255.0
test_images = test_images / 255.0

# array의 중복을 제거하고 라벨 수를 구하는 코드
nb_classes = len(set(train_labels))

# MNIST data image of shape 28 * 28 = 784
X = tf.placeholder(tf.float32, [None, 784])
# 0 - 9 digits recognition = 10 classes
# Y = tf.placeholder(tf.float32, [None, nb_classes])
Y = tf.placeholder(tf.int32, [None, 1])
Y_one_hot = tf.one_hot(Y, nb_classes, dtype=tf.float32)
Y_one_hot = tf.reshape(Y_one_hot, [-1, nb_classes])

W = tf.Variable(tf.random_normal([784, nb_classes]))
b = tf.Variable(tf.random_normal([nb_classes]))

# 위의 가중치인 W와 images의 차원을 맞추어 주기 위해 reshape를 진행

train_images = train_images.reshape(-1, 28*28)
test_images = test_images.reshape(-1, 28*28)

## train
train_labels = train_labels.reshape(-1, 1)
## test
test_labels = test_labels.reshape(-1, 1)

# Hypothesis (using softmax)
logits = tf.matmul(X, W) + b
hypothesis = tf.nn.softmax(tf.matmul(X, W) + b)

# 이 두 함수 차이점과 공통점에 대해 알아보기
cost = tf.reduce_mean(tf.nn.softmax_cross_entropy_with_logits_v2(logits=logits,
                                                                 labels=[Y_one_hot]))

# cost = tf.reduce_mean(-tf.reduce_sum(Y * tf.log(hypothesis), axis=1))

train = tf.train.GradientDescentOptimizer(learning_rate=0.1).minimize(cost)

# Test model
is_correct = tf.equal(tf.argmax(hypothesis, 1), tf.argmax(Y_one_hot, 1))
# Calculate accuracy
accuracy = tf.reduce_mean(tf.cast(is_correct, tf.float32))

# parameters
num_epochs = 15
batch_size = 100
num_iterations = int(int(train_labels.shape[0]) / batch_size)

epoch_list = []
batch_list = []
cost_list_batch = []
cost_list_epoch = []

with tf.Session() as sess:
    # Initialize TensorFlow variables
    sess.run(tf.global_variables_initializer())
    # Training cycle
    for epoch in range(num_epochs):
        avg_cost = 0

        for i in range(num_iterations):
            index = i*batch_size
            batch_xs = train_images[index:index+batch_size,:]
            batch_ys = train_labels[index:index+batch_size,:]
            _, cost_val = sess.run([train, cost], feed_dict={X: batch_xs, Y: batch_ys})
            avg_cost += cost_val / num_iterations

            batch_list.append(i+1)
            cost_list_batch.append(cost_val)


        epoch_list.append(epoch)
        cost_list_epoch.append(avg_cost)

        print("Epoch: {:04d}, Cost: {:.9f}".format(epoch + 1, avg_cost))

    print("Learning finished")

    # Test the model using test sets
    print(
        "Accuracy: ",
        accuracy.eval(
            session=sess, feed_dict={X: test_images, Y: test_labels}
        ),
    )

# 그래프 출력
total = pd.DataFrame(cost_list_batch[0:600])

for i in range(0, 15):
    sub = pd.DataFrame(cost_list_batch[600*i : (i+1)*600])
    total = pd.concat([total, sub], axis = 1)
total = total.iloc[: , range(1, len(total.columns))]

total.columns = ['epoch_1', 'epoch_2', 'epoch_3', 'epoch_4', 'epoch_5', 'epoch_6', 'epoch_7',
                 'epoch_8', 'epoch_9', 'epoch_10', 'epoch_11', 'epoch_12', 'epoch_13', 'epoch_14',
                 'epoch_15']

plt.rcParams["figure.figsize"] = (40,25)

plt.plot(total)
plt.legend(['epoch_1', 'epoch_2', 'epoch_3', 'epoch_4', 'epoch_5', 'epoch_6', 'epoch_7',
                 'epoch_8', 'epoch_9', 'epoch_10', 'epoch_11', 'epoch_12', 'epoch_13', 'epoch_14',
                 'epoch_15'], fontsize=35)
plt.show